Hive Performance: Hive-LLAP in HDP 3.1.4 vs Hive 3/4 on MR3 0.10
Nov 3, 2019
Read in 7 minutes
Introduction
In our previous article published in October 2018, we use the TPC-DS benchmark to compare the performance of Hive-LLAP in HDP 3.0.1 (as well as HDP 2.6.4) and Hive 3 on MR3 0.4. We have shown that Hive 3 on MR3 yields consistently higher throughput than Hive-LLAP in concurrency tests, but since then, the performance of Hive-LLAP has improved considerably for concurrent queries. Thus we are interested in the question of how Hive on MR3 compares with Hive-LLAP in the latest lease of HDP.
In this article, we evaluate the performance of Hive-LLAP in HDP 3.1.4, the latest release of HDP, and Hive 3.1.2 on MR3 0.10 using both sequential and concurrency tests. As MR3 supports Hive 4 as well, we include Hive 4.0.0-SNAPSHOT on MR3 0.10 in the evaluation. The objective of the experiment is to demonstrate that in comparison with Hive-LLAP in the latest release of HDP, Hive on MR3 continues to remain competitive in its performance. As in the previous experiment, we use the TPC-DS benchmark.
Cluster to use in the experiment
We run the experiment in a 20-node cluster, called Indigo, consisting of 1 master and 19 slaves. All the machines in the Indigo cluster run HDP 3.1.4 and share the following properties:
- 2 x Intel(R) Xeon(R) X5650 CPUs (with hyper-threading enabled)
- 96GB of memory
- 6 x 500GB HDDs
- 10 Gigabit network connection
The memory size for Yarn on a slave node is 84GB. The scale factors for the TPC-DS benchmark are 3TB and 10TB. We generate both datasets in ORC.
We use a variant of the TPC-DS benchmark introduced in our previous article which replaces an existing LIMIT clause with a new SELECT clause so that different results from the same query translate to different numbers of rows. The reader can find the modified TPC-DS queries in the GitHub repository.
SQL-on-Hadoop systems to compare
We compare the following SQL-on-Hadoop systems.
- Hive-LLAP in HDP 3.1.4
- Hive 3.1.2 running on MR3 0.10
- Hive 4.0.0-SNAPSHOT (retrieved in October 2019) running on MR3 0.10
We use the default configuration for Hive-LLAP under which each LLAP daemon runs 20 executors of 4GB each.
We use the configuration included in the MR3 release (hive3/hive-site.xml, hive4/hive-site.xml, mr3/mr3-site.xml, tez/tez-site.xml under conf/tpcds/).
For Hive on MR3, a ContainerWorker uses 40GB of memory, with up to 10 tasks concurrently running in each ContainerWorker.
Results of sequential tests
In a sequential test, we submit 99 queries from the TPC-DS benchmark and use a scale factor of 10TB. We measure the running time of each query and the number of rows in the result. If the result contains a single row, we compute the sum of all numerical values in it.
For the reader's perusal, we attach the table containing the raw data of the experiment. Here is a link to [Google Docs].
Analysis 1 - Correctness
For every query, the three systems return the same number of rows. The only exception is query 70, for which Hive 3 on MR3 reports 124 rows whereas both Hive-LLAP and Hive 4 on MR3 report 25 rows. From our analysis, it is very likely that Hive-LLAP and Hive 4 on MR3 return wrong results.
- For the same scale factor of 10TB, Presto returns 124 rows, as shown in our previous article. Since Hive 3 and Presto are developed independently of each other, both systems return the correct answer with an extremely high probability.
- Even Hive-LLAP returns 124 rows from query 70 on an equivalent dataset in text format (which is converted to ORC).
We suspect that both Hive-LLAP and Hive 4 incorporate a certain commit that somehow affects the result of query 70.
Analysis 2 - Running time
We summarize running times as follows:
- The three systems successfully finish all 99 queries.
- Hive-LLAP takes 16812 seconds to execute all 99 queries.
- Hive 3.1.2 on MR3 0.10 takes 17848 seconds to execute all 99 queries.
- Hive 4.0.0-SNAPSHOT on MR3 0.10 takes 16396 seconds to execute all 99 queries.
- Overall Hive 3.1.2 on MR3 0.10 runs slightly slower than Hive-LLAP and Hive 4.0.0-SNAPSHOT on MR3 0.10.
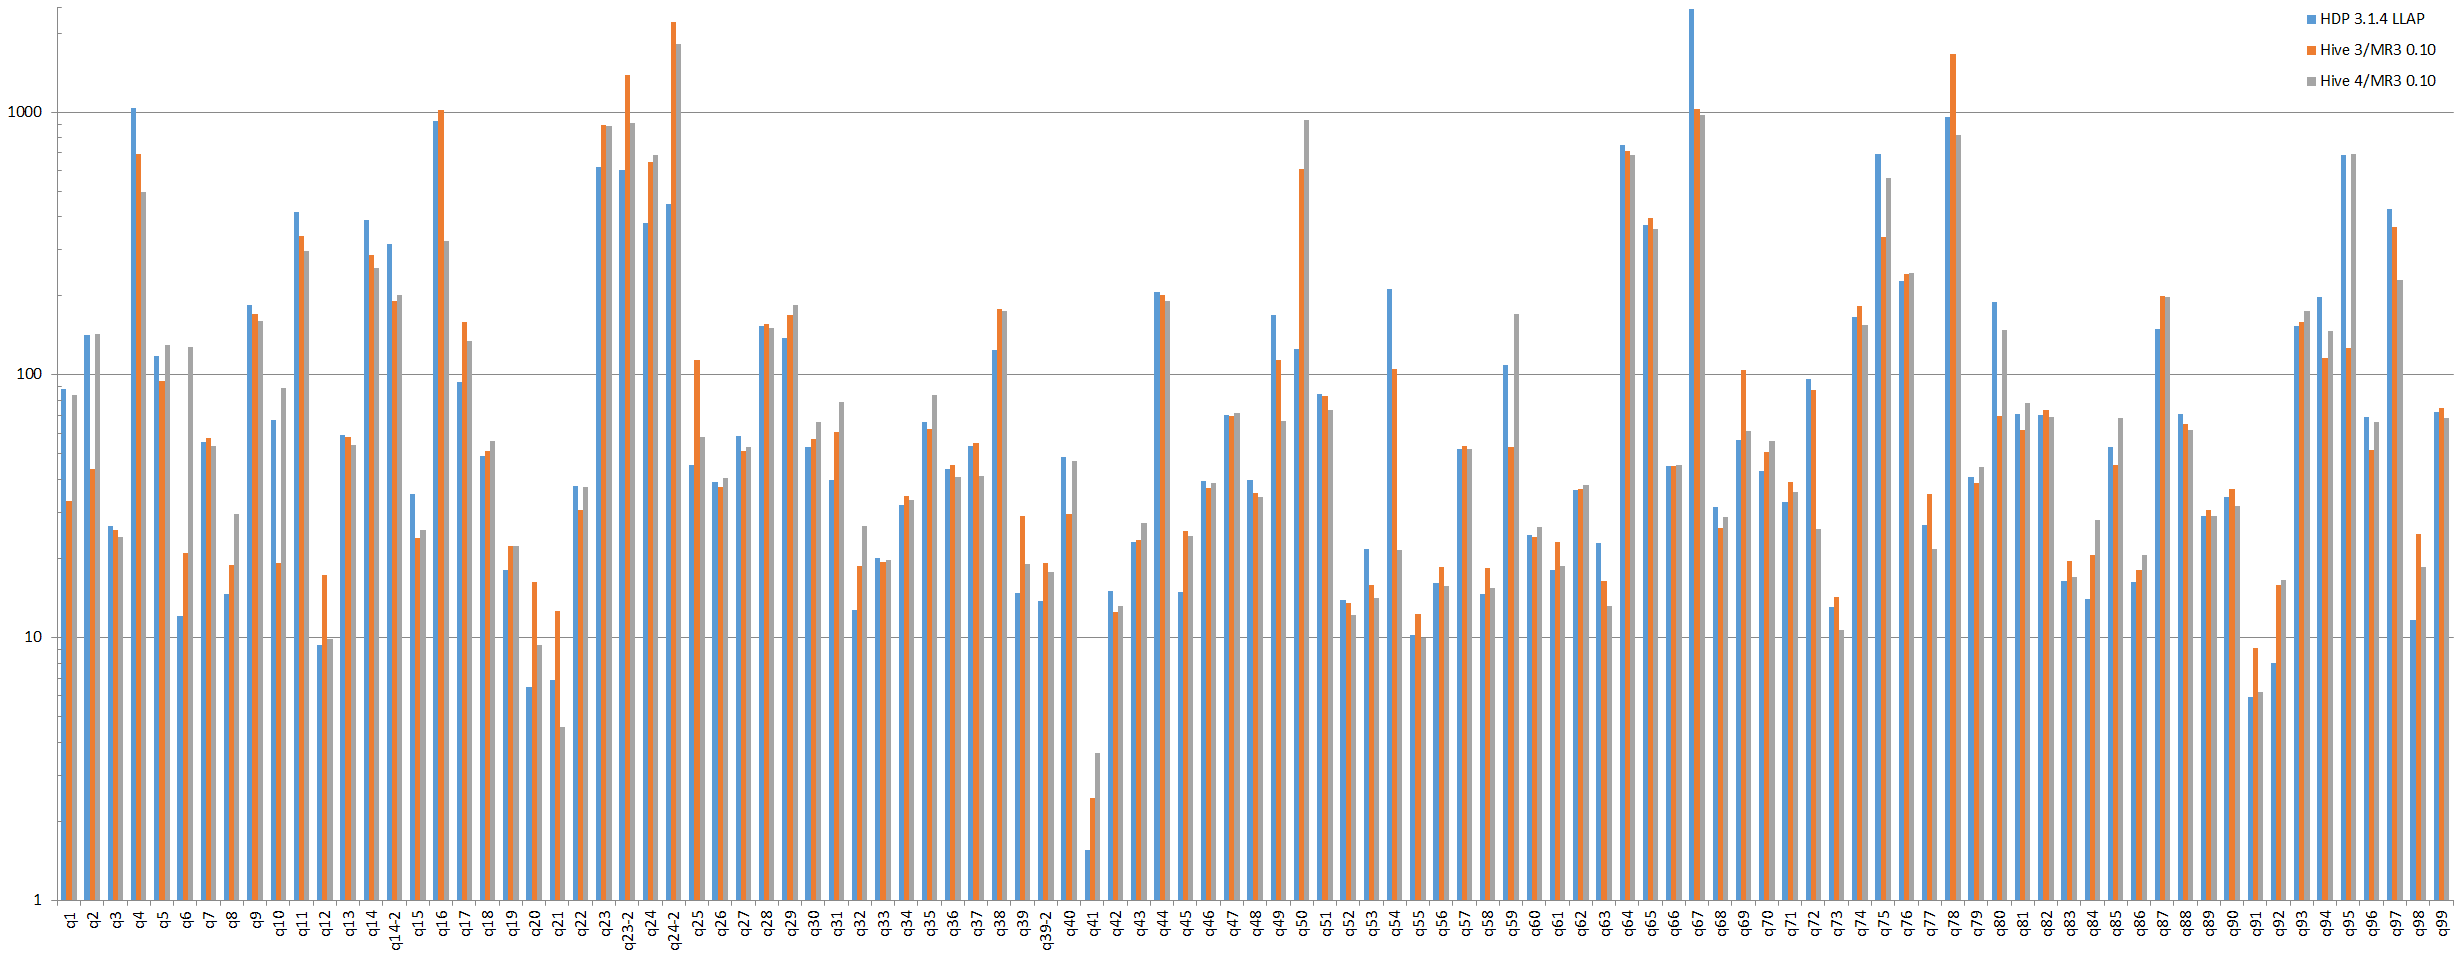
For long-running queries such as query 16, 23, 24, 67, and 95, large discrepancies in the running time are due to different query plans (i.e., results of compiling queries), not differences in the performance of the underlying systems. The fact that Hive-LLAP and Hive 4.0.0-SNAPSHOT are sometimes much slower than Hive 3.1.2 suggests the difficulty of devising an optimization scheme that universally benefits all kinds of SQL queries, especially for such mature systems as Hive. For example, in comparison with Hive 3.1.2, Hive 4.0.0-SNAPSHOT achieves a huge reduction in the running time for query 16 (from 1022 seconds to 323 seconds), but suffers from a huge increase in the running time for query 95 (from 126 seconds to 695 seconds).
Analysis 3. Ranks for individual queries
In order to gain a sense of which system answers queries fast, we rank the three systems according to the running time for each individual query. The system that completes executing a query the fastest is assigned the highest place (1st) for the query under consideration. In this way, we can evaluate the three systems more accurately from the perspective of end users, not of system administrators.
- From left to right, the column corresponds to: Hive-LLAP in HDP 3.1.4, Hive 3.1.2 on MR3 0.10, Hive 4.0.0-SNAPSHOT on MR3 0.10.
- The first place to the third place is colored in dark green (first), green, light green (third).
![]()
![]()
We observe that none of the systems finishes all queries consistently faster than the other two. Similarly to the previous analysis, however, Hive 3.1.2 on MR3 0.10 runs slightly slower than Hive-LLAP and Hive 4.0.0-SNAPSHOT on MR3 0.10 on the whole.
Results of concurrency tests
In our experiment, we choose a concurrency level from 1 to 16 and start as many Beeline clients (from 1 client up to 16 clients), each of which submits 17 queries, query 25 to query 40, from the TPC-DS benchmark. In order to better simulate a realistic environment, each Beeline client submits these 17 queries in a unique sequence. For each run, we measure the longest running time of all the clients. Since the cluster remains busy until the last client completes the execution of all its queries, the longest running time can be thought of as the cost of executing queries for all the clients.
Analysis 1. Scale factor of 3TB
The following table and graph show the results of concurrency tests with a scale factor of 3TB. We also derive from the running time a new metric, called concurrency factor, quantifying the overall efficiency in managing concurrent queries.
- concurrency factor = running time in a concurrency test / (concurrency level * running time in an equivalent sequential test)
Thus a concurrency factor indicates ‘‘how long it takes to finish a single query in a concurrency test (or in a concurrent environment) relative to the time for finishing the same query in a sequential test (or in a single-user environment).’’ We refer the reader to our previous article for more details on concurrency factors.
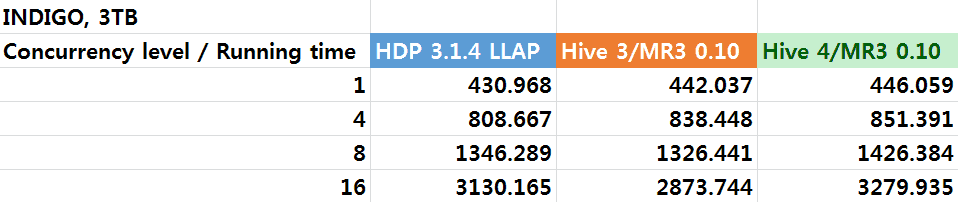
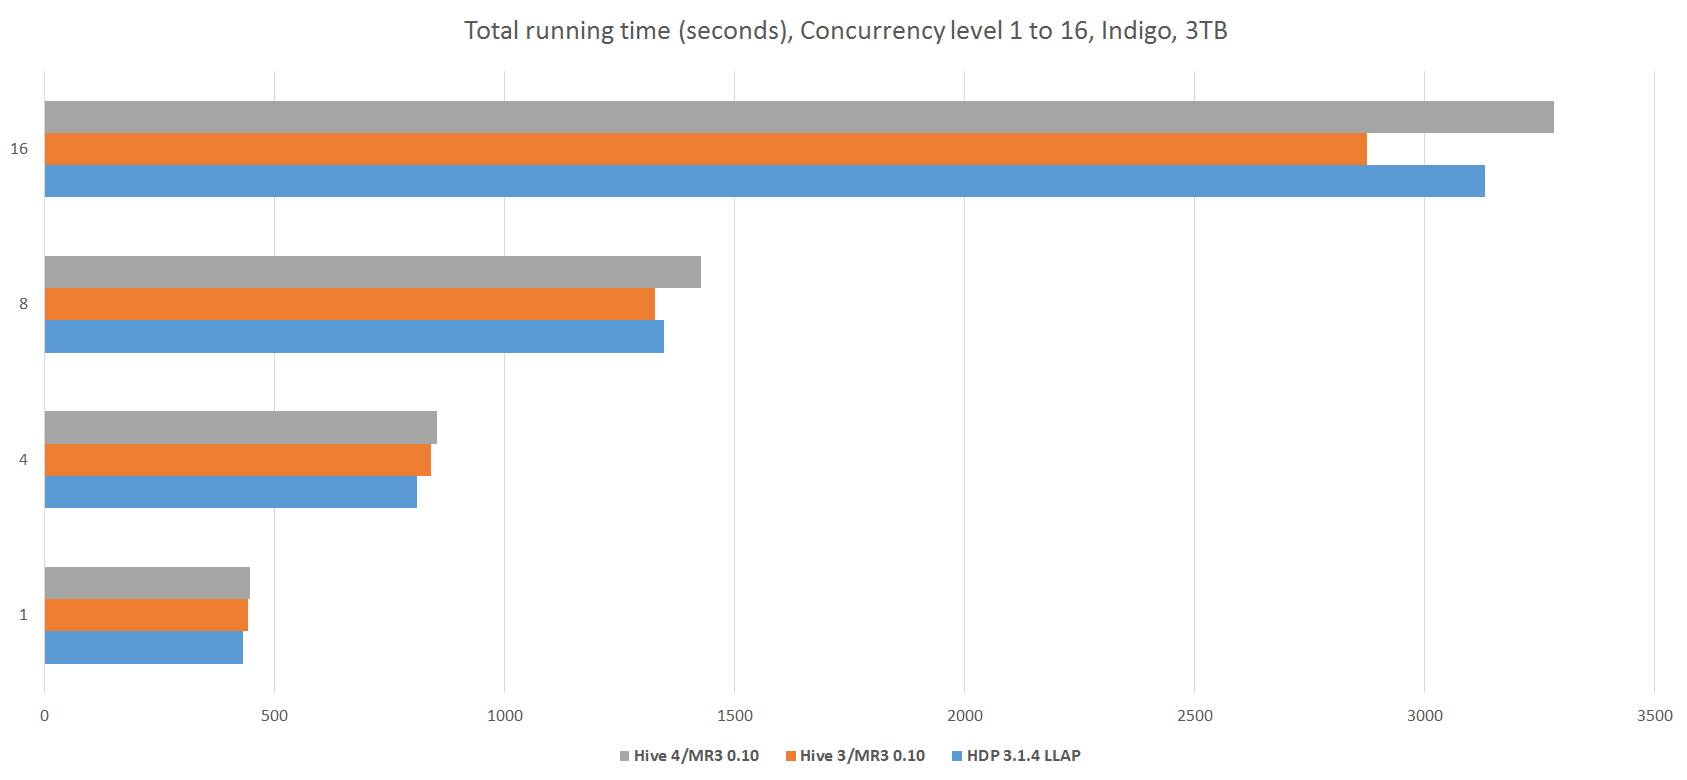
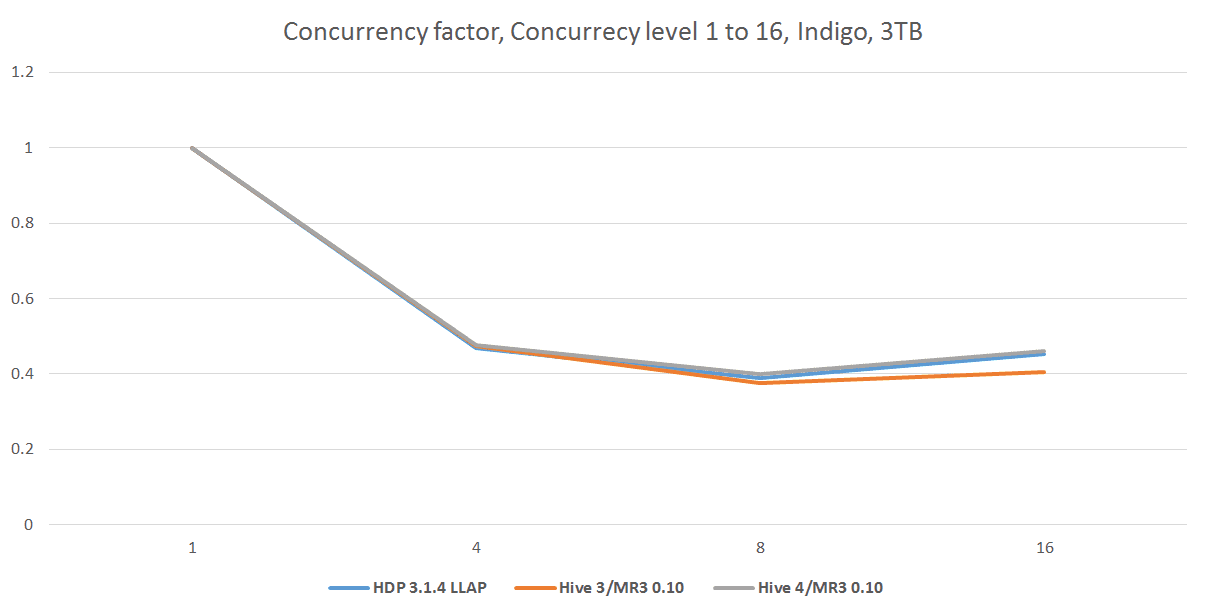
From the experiment, we observe that the three systems are comparable in performance for concurrency tests. For the concurrency level of 16, Hive 3.1.2 on MR3 0.10 runs slightly faster than the other two systems. The fact that the concurrency factor stays below 0.5 implies that on the dataset of 3TB, running the 17 queries sequentially consumes approximately half the resources of the cluster. This is no longer the case when we use a scale factor of 10TB.
Analysis 2. Scale factor of 10TB
The following table and graphs show the results of concurrency tests with a scale factor of 10TB.
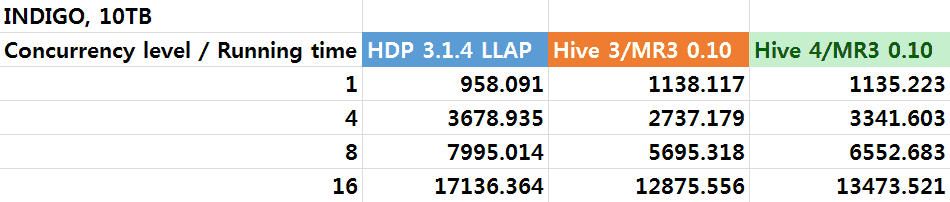
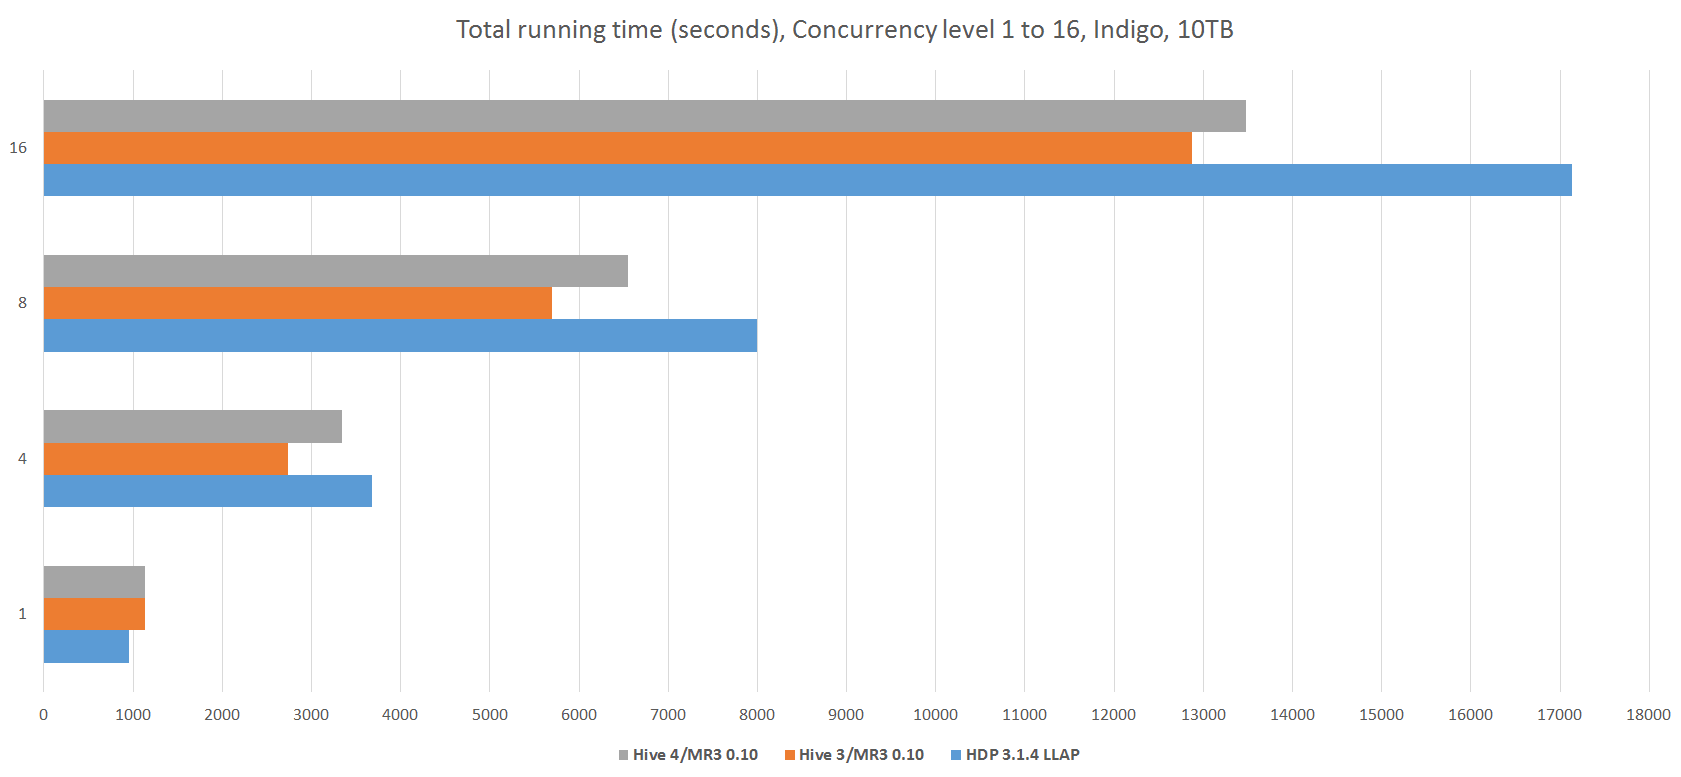
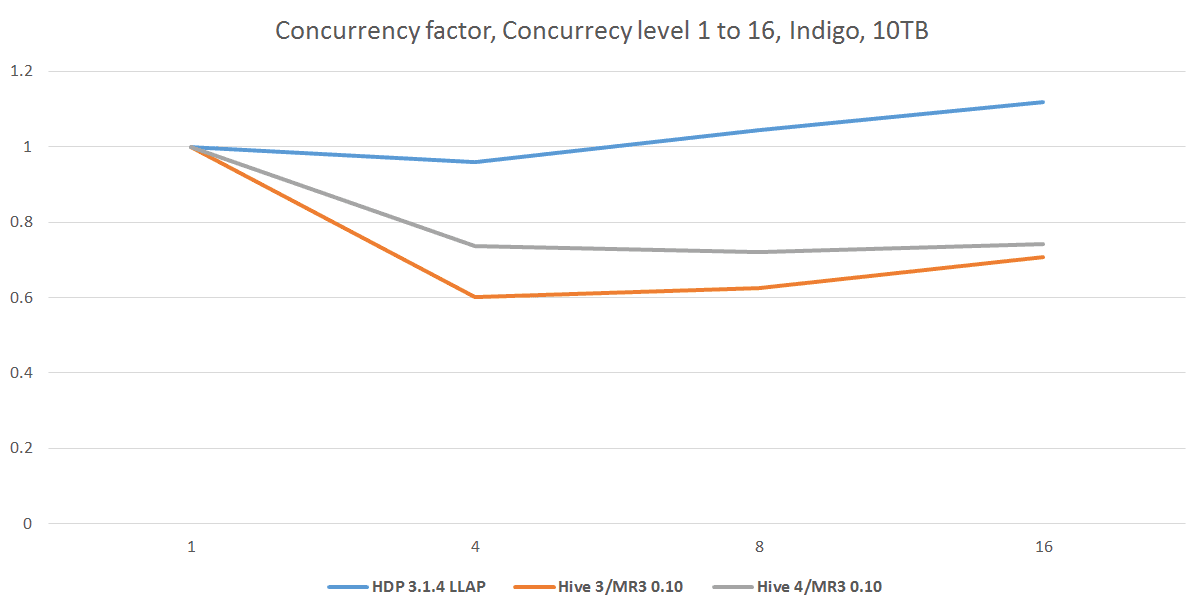
We observe that from the concurrency level of 4, Hive on MR3 0.10 runs noticeably faster than Hive-LLAP, despite the fact that Hive-LLAP runs faster when all queries are executed sequentially. This suggests that Hive-LLAP incurs a large overhead of executing concurrent queries, as evidenced by its concurrency factor which stays around 1.0. (Recall that a concurrency factor of 1.0 is exhibited by a system that is executing queries only sequentially.) Thus we conclude that for a dataset too large for the resources of the cluster (e.g., TPC-DS dataset of 10TB on Indigo), Hive on MR3 makes better use of resources than Hive-LLAP when executing concurrent queries.
Conclusion
In comparison with Hive-LLAP, Hive on MR3 has its own strengths (such as low concurrency factors), but it runs slightly slower than Hive-LLAP when executing a single query with the same query plan. This is mostly because in the current implementation, Hive on MR3 uses the Tez runtime which is designed on the assumption that only a single Task (equivalent to an executor in Hive-LLAP) runs at a time inside the Java process. We are currently optimizing the Tez runtime for the typical case in which multiple Tasks run concurrently inside the Java process.