Performance Comparison of HDP LLAP, Presto, SparkSQL, Hive on Tez, and Hive on MR3 using the TPC-DS Benchmark
Aug 15, 2018
Read in 8 minutes
NOTE: This article is superceded by a new article expanded with results of concurrency tests on newer versions of SQL-on-Hadoop systems. We strongly recommend the reader to read the new article instead: Performance Evaluation of SQL-on-Hadoop Systems using the TPC-DS Benchmark.
Introduction
We often ask questions on the performance of SQL-on-Hadoop systems:
- How fast or slow is Hive-LLAP in comparison with Presto, SparkSQL, or Hive on Tez?
- As it is an MPP-style system, does Presto run the fastest if it successfully executes a query?
- As it stores intermediate data in memory, does SparkSQL run much faster than Hive on Tez in general?
- …
While interesting in their own right, these questions are particularly relevant to industrial practitioners who want to adopt the most appropriate technology to meet their need.
There are a plethora of benchmark results available on the internet, but we still need new benchmark results. Since all SQL-on-Hadoop systems constantly evolve, the landscape gradually changes and previous benchmark results may already be obsolete. Moreover the hardware employed in a benchmark may favor certain systems only, and a system may not be configured at all to achieve the best performance. On the other hand, the TPC-DS benchmark continues to remain as the de facto standard for measuring the performance of SQL-on-Hadoop systems.
In this article, we report our experimental results to answer some of those questions regarding SQL-on-Hadoop systems. The results are by no means definitive, but should shed light on where each system lies and in which direction it is moving in the dynamic landscape of SQL-on-Hadoop. In particular, the results may contradict some common beliefs on Hive, Presto, and SparkSQL.
Clusters to use in the experiment
We run the experiment in two different clusters: Red and Gold. All the machines in both clusters share the following properties:
- 2 x Intel(R) Xeon(R) X5650 CPUs
- 192GB of memory on Red, 96GB of memory on Gold
- 6 x 500GB HDDs
- 10 Gigabit network connection
- HDFS replication factor of 3
- Hadoop 2.7.3 running Hortonworks Data Platform (HDP) 2.6.4
| Red | Gold | ||
|---|---|---|---|
| Number of master nodes | 1 | 2 | |
| Number of slave nodes | 10 | 40 | |
| Scale factor for the TPC-DS benchmark | 1TB | 10TB | |
| Memory size for Yarn on a slave node | 168GB | 84GB | |
| Security | Kerberos | No |
In total, the amount of memory of slaves nodes is 10 * 196GB = 1960GB on the Red cluster and 40 * 96GB = 3840GB on the Gold cluster.
SQL-on-Hadoop systems to compare
We compare six different SQL-on-Hadoop systems that are available on Hadoop 2.7. Note that Hive 3.0.0 is officially supported only on Hadoop 3, so we have modified the source code so as to run it on Hadoop 2.7.
- Hive-LLAP included in HDP 2.6.4
- Presto 0.203e (with cost-based optimization enabled)
- SparkSQL 2.2 included in HDP 2.6.4
- Hive 3.0.0 running on top of Tez
- Hive 3.0.0 running on top of MR3
- Hive 2.3.3 running on top of MR3
For Hive-LLAP, we use the default configuration set by Ambari. An LLAP daemon uses 160GB on the Red cluster and 76GB on the Gold cluster. An ApplicationMaster uses 4GB on both clusters.
For Presto, we use the following configuration (which we have chosen after performance tuning):
# for the Red cluster
query.initial-hash-partitions 10
query.max-memory-per-node 120GB
query.max-total-memory-per-node 120GB
memory.heap-headroom-per-node 16GB
resources.reserved-system-memory 24GB
sink.max-buffer-size 20GB
node-scheduler.min-candidates 10

# for the Gold cluster
query.initial-hash-partitions 40
query.max-memory-per-node 60GB
query.max-total-memory-per-node 60GB
memory.heap-headroom-per-node 8GB
resources.reserved-system-memory 12GB
sink.max-buffer-size 10GB
node-scheduler.min-candidates 40

# for both clusters
task.writer-count 4
node-scheduler.network-topology flat
optimizer.optimize-metadata-queries TRUE
join-distribution-type AUTOMATIC
optimizer.join-reordering-strategy COST_BASED
A Presto worker uses 144GB on the Red cluster and 72GB on the Gold cluster (for JVM -Xmx).
For SparkSQL,
we use the default configuration set by Ambari, with spark.sql.cbo.enabled and spark.sql.cbo.joinReorder.enabled set to true in addition.
Spark Thrift Server uses the option --num-executors 19 --executor-memory 74g on the Red cluster and --num-executors 39 --executor-memory 72g on the Gold cluster.
For Hive 3.0.0 and 2.3.3, we use the configuration included in the MR3 release 0.3 (hive2/hive-site.xml, hive5/hive-site.xml, mr3/mr3-site.xml, tez3/tez-site.xml under conf/tpcds/).
For Hive on Tez, a container uses 16GB on the Red cluster and 10GB on the Gold cluster.
For Hive on MR3, a container uses 16GB on the Red cluster (with a single Task running in each ContainerWorker) and 20GB on the Gold cluster (with up to two Tasks running in each ContainerWorker).
Experimental results
For each run, we submit 99 queries from the TPC-DS benchmark with a Beeline connection or a Presto client. Since query 14, 23, and 39 proceed in two stages, we execute a total of 103 queries. If a query fails, we measure the time to failure and move on to the next query. We set a timeout of 7200 seconds for Hive 2.3.3 on MR3.
For the reader's perusal, we attach two tables containing the raw data of the experiment. A running time of 0 seconds means that the query does not compile, and a negative running time, e.g., -639.367, means that the query fails in 639.367 seconds. Here is a link to [Google Docs].
Analysis 1. Number of completed queries
We count the number of queries that successfully return answers:
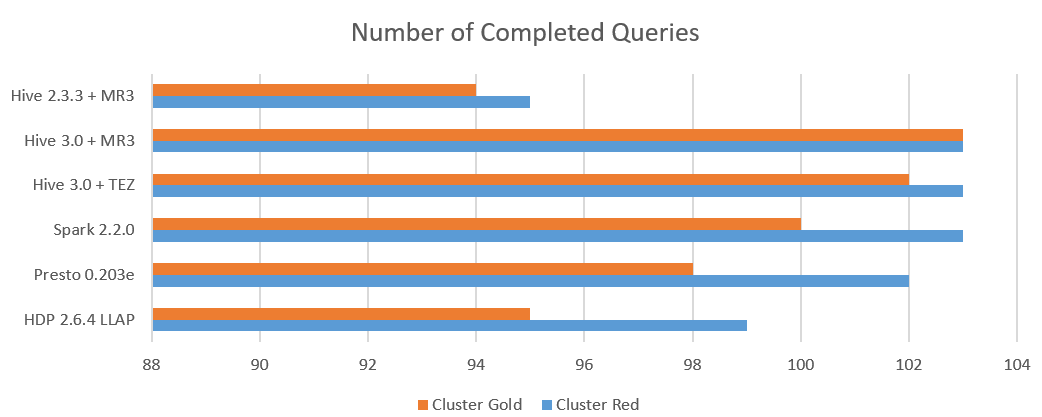
Here is the summary:
- Hive 3.0.0 on MR3 completes executing all 103 queries on both clusters.
- Hive 3.0.0 on Tez completes executing all 103 queries on the Red cluster, but fails to complete executing query 81 on the Gold cluster.
- Spark 2.2.0 completes executing all 103 queries on the Red cluster, but fails to complete executing query 14 and 28 on the Gold cluster.
- Presto 0.203e fails to complete executing some queries on both clusters.
- Hive-LLAP in HDP 2.6.4 does not compile query 58 and 83, and fails to complete executing a few other queries.
Analysis 2. Total running time
We measure the total running time of all queries, whether successful or not:

Unfortunately it is hard to make a fair comparison from this result because not all the systems are consistent in the set of completed queries. For example, Hive 2.3.3 on MR3 takes over 21,000 seconds on the Red cluster because query 16 and 94 fail with a timeout after 7200 seconds, thus accounting for two thirds of the total running time. Nevertheless we can make a few interesting observations:
- Hive 3.0.0 on MR3 finishes all 103 queries the fastest on both clusters. In particular, it achieves a reduction of about 25% in the total running time when compared with Hive 3.0.0 on Tez.
- Spark 2.2.0 is the slowest on both clusters not because some queries fail with a timeout, but because almost all queries just run slow.
- Hive 3.0.0 on Tez is fast enough to outperform Presto 0.203e and Spark 2.2.0.
Analysis 3. Ranks for individual queries
In order to gain a sense of which system answers queries fast, we rank all the systems according to the running time for each individual query. For example, a system that completes executing a query the fastest is assigned the highest place (1st) for the query under consideration. If a system does not compile or fails to complete executing a query, it is assigned the lowest place (6th) for the query under consideration. In this way, we can evaluate the six systems more accurately from the perspective of end users, not of system administrators.
Here is the result from the Red cluster:
- From left to right, the column corresponds to: Hive-LLAP, Presto 0.203e, SparkSQL 2.2, Hive 3.0.0 on Tez, Hive 3.0.0 on MR3, Hive 2.3.3 on MR3.
- The first place to the last place is colored in dark green (first), green, light green, light grey, grey, dark grey (last).
![]()
![]()
We observe that Hive-LLAP in HDP 2.6.4 dominates the competition: it places first for 72 queries and second for 14 queries. Next comes Hive 3.0.0 on MR3, which places first for 12 queries and second for 48 queries. Presto 0.203e places first for 11 queries, but places second only for 9 queries. Note that while Hive-LLAP place first for the most number of queries, it also places last for 10 queries. In contrast, Hive 3.0.0 on MR3 does not place last for any query.
From the Gold cluster, a noticeable change emerges:
![]()
![]()
Hive-LLAP in HDP 2.6.4 still places first for the most number of queries (41 queries, down from 72 queries on the Red cluster), but it also places last for 13 queries (up from 10 queries on the Red cluster). Hive 3.0.0 on MR3 places first for 28 queries and second for 44 queries, and does not place last for any query. Overall Hive 3.0.0 on MR3 is comparable to Hive-LLAP: Hive 3.0.0 on MR3 places first or second for a total of 72 queries without placing last for any query, whereas Hive-LLAP places first or second for a total of 63 queries.
Conclusion
From our analysis above, we see that those systems based on Hive are indeed strong competitors in the SQL-on-Hadoop landscape, not only for their stability and versatility but now also for their speed. We also see that MR3 is a new execution engine for Hive that competes well with LLAP, by virtue of its comparable speed and such additional features as elastic allocation of cluster resources, full implementation of impersonation, easy deployment, and so on. In a follow-up article, we will evaluate SQL-on-Hadoop systems in a concurrent execution setting.